Treatment Analysis
The Treatment Analysis section in Clinical Analytics scorecards allows hospitals to see data for all treatments across the hospital. The data can be sorted by treatment, charge/cost, number of cases, and other attributes.
Treatment Analysis can identify procedures that may be overused. For example, a large number of CT scans may require investigation to better understand utilization. CT scans may be overused in certain DRG groups. Understanding this helps lower costs for the facility by reducing medically unnecessary CT scans.
Add the section
You can add a Treatment Analysis section to any scorecard by clicking +Add Section and selecting Treatment Analysis. For more information, see Customize scorecards.
There are no customization options in Customizer Mode when adding this section.

Work with data
The Treatment Analysis section offers you several customization parameters for your analysis. To change your selection, click the pencil icon.

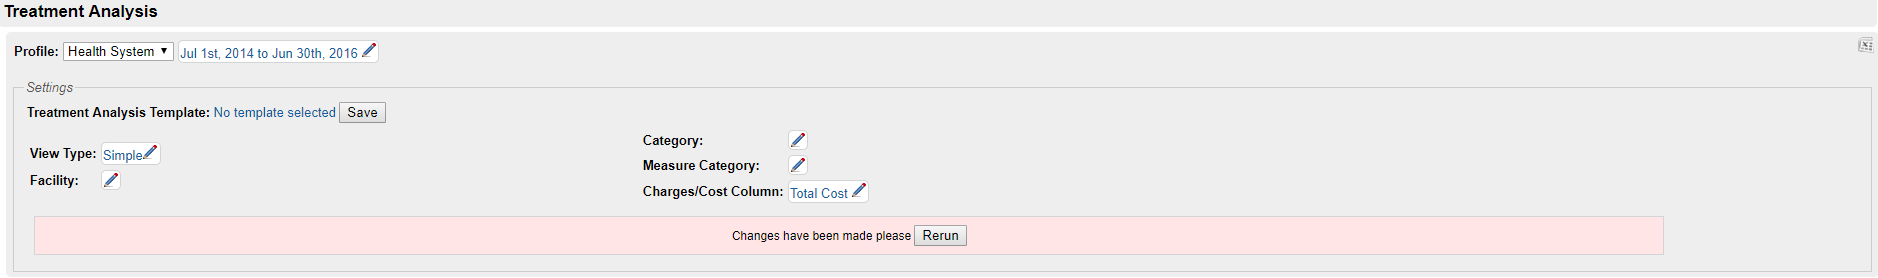
- Treatment Analysis is a profiles-based section, so you can start your analysis by selecting one of your internal profiles from the Profile dropdown and selecting your time period of interest.
- Treatment Analysis offers internal analytics so you can compare treatment plans within your health system; there is not an option to select a benchmark.
- The parameter settings of your Treatment Analysis section can be saved as a Treatment Analysis template. See Section-specific templates for more information.
- As with most Scorecards sections, you can export your data table as an Excel spreadsheet by clicking the icon in the top right corner.

When you change any of the section parameter settings, a red box appears below the menu. Click the Rerun button to run the data search again, recalculating the results according to the options you chose.

| Parameter | Function |
|---|---|
| View Type | Select if you would like the Simple or Detailed data table; see the column descriptions below for details. |
| Facility | If you would like to filter by facility, select one or more facilities to be included; not selecting any facilities returns data for all facilities. |
| Category | Select one or more high-level revenue code categories; not selecting a category returns all categories. For more information, see Revenue Code categories. |
| Measure Category | Select one or more specific revenue code categories; not selecting a measure category returns all categories. These measure categories match the domains in the Charges and Costs Detail section. |
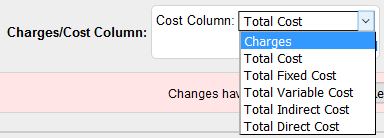
| Charges/Cost Column |
Choose which charges or costs to display in the cost and charge columns. Choose from charges, total cost, total fixed cost, total variable cost, total indirect cost, and total direct cost.
The menu selection affects two columns in the table - one in the middle and the last column on the right side. The section below explains how the columns change and what they mean. The benchmark cost and charge data come from within the hospital system only (there are no external benchmarks available in this section). |
Understand the data table
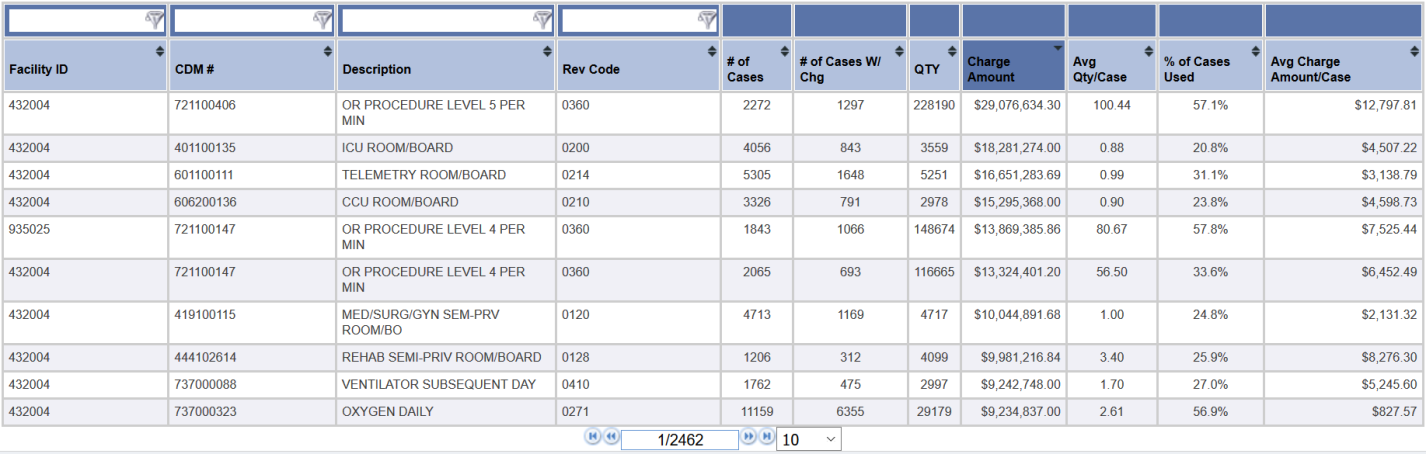
This table functions like others in Clinical Analytics with sorting and filtering. See Table functionality for more information.
The following tables describe the columns in the data table. Note that selecting the Detailed View Type offers a few additional columns (noted with an asterisk *). The Charges/Cost Column selection affects which columns you see, so we have provided a separate table for each Charges/Cost Column option.
Charges/Cost Column options include (click the hyperlink to view the table of columns for that selection):
- Charges/Cost Column: Acquisition Cost
- Charges/Cost Column: Charges/Charge Amount
- Charges/Cost Column: Total Cost
- Charges/Cost Column: Total Fixed Cost
- Charges/Cost Column: Total Variable Cost
- Charges/Cost Column: Total Indirect Cost
- Charges/Cost Column: Total Direct Cost
Charges/Cost Column: Acquisition Cost
| Column | Description |
|---|---|
| Facility ID | ID number of the facility associated with the CDM. |
| CDM # (Charge Description Master Number) | A hospital-specific identification number for the charge description. |
| Description | Hospital-specific name for the CDM charge. |
| Rev (Revenue) Code | An industry-standard grouping for charges; see Revenue Code Categories for a list of revenue codes. |
| Profile Volume* | *only in Detailed View Type; volume of encounters in the profile for that facility. |
| Profile Volume w/ Chg | Profile Volume with Charge: Number of encounters in the profile with charges for that CDM. |
| Profile Qty | Profile Quantity: Quantity of that CDM charged across the profile. |
| Profile Acquisition Cost | Total amount of acquisition costs for that CDM across the profile. This is the default sort column when the table displays. |
| Avg Qty/Case w/ Chg |
Average Quantity per Case with Charge: (Profile Quantity) divided by (Profile Volume with Charge). This is the average number of times that CDM was charged to each encounter (for cases with that charge). |
| % of Cases Used* |
*only in Detailed View Type; Percent of Cases Used: (Profile Volume with Charge) divided by (Profile Volume). This is the percent of the profile encounters that had at least one charge for that CDM. |
| Avg Acquisition Cost/Case w/ Chg |
Average Acquisition Cost per Case with Charge: (Profile Acquisition Cost) divided by (Profile Volume with Charge). This is the average acquisition cost for that CDM for each encounter with that charge. |
Charges/Cost Column: Charges/Charge Amount
| Column | Description |
|---|---|
| Facility ID | ID number of the facility associated with the CDM. |
| CDM # (Charge Description Master Number) | A hospital-specific identification number for the charge description. |
| Description | Hospital-specific name for the CDM charge. |
| Rev (Revenue) Code | An industry-standard grouping for charges; see Revenue Code Categories for a list of revenue codes. |
| Profile Volume* | *only in Detailed View Type; volume of encounters in the profile for that facility. |
| Profile Volume w/ Chg | Profile Volume with Charge: Number of encounters in the profile with charges for that CDM. |
| Profile Qty | Profile Quantity: Quantity of that CDM charged across the profile. |
| Profile Charge Amount | Total amount of charges for that CDM across the profile. This is the default sort column when the table displays. |
| Avg Qty/Case w/ Chg |
Average Quantity per Case with Charge: (Profile Quantity) divided by (Profile Volume with Charge). This is the average number of times that CDM was charged to each encounter (for cases with that charge). |
| % of Cases Used* |
*only in Detailed View Type; Percent of Cases Used: (Profile Volume with Charge) divided by (Profile Volume). This is the percent of the profile encounters that had at least one charge for that CDM. |
| Avg Charge Amount/Case w/ Chg |
Average Charge Amount per Case with Charge: (Profile Charge Amount) divided by (Profile Volume with Charge). This is the average amount that each encounter was charged for that CDM (for cases with that charge). |
Charges/Cost Column: Total Cost
| Column | Description |
|---|---|
| Facility ID | ID number of the facility associated with the CDM. |
| CDM # (Charge Description Master Number) | A hospital-specific identification number for the charge description. |
| Description | Hospital-specific name for the CDM charge. |
| Rev (Revenue) Code | An industry-standard grouping for charges; see Revenue Code Categories for a list of revenue codes. |
| Profile Volume* | *only in Detailed View Type; volume of encounters in the profile for that facility. |
| Profile Volume w/ Chg | Profile Volume with Charge: Number of encounters in the profile with charges for that CDM. |
| Profile Qty | Profile Quantity: Quantity of that CDM charged across the profile. |
| Profile Total Cost | Sum of all costs for that CDM across the profile. This is the default sort column when the table displays. |
| Avg Qty/Case w/ Chg |
Average Quantity per Case with Charge: (Profile Quantity) divided by (Profile Volume with Charge). This is the average number of times that CDM was charged to each encounter (for cases with that charge). |
| % of Cases Used* |
*only in Detailed View Type; Percent of Cases Used: (Profile Volume with Charge) divided by (Profile Volume). This is the percent of the profile encounters that had at least one charge for that CDM. |
| Avg Total Cost /Case w/ Chg |
Average Total Cost per Case with Charge: (Profile Total Cost) divided by (Profile Volume with Charge). This is the average amount of costs incurred for that CDM by each encounter (for cases with that charge). |
Charges/Cost Column: Total Fixed Cost
| Column | Description |
|---|---|
| Facility ID | ID number of the facility associated with the CDM. |
| CDM # (Charge Description Master Number) | A hospital-specific identification number for the charge description. |
| Description | Hospital-specific name for the CDM charge. |
| Rev (Revenue) Code | An industry-standard grouping for charges; see Revenue Code Categories for a list of revenue codes. |
| Profile Volume* | *only in Detailed View Type; volume of encounters in the profile for that facility. |
| Profile Volume w/ Chg | Profile Volume with Charge: Number of encounters in the profile with charges for that CDM. |
| Profile Qty | Profile Quantity: Quantity of that CDM charged across the profile. |
| Profile Total Fixed Cost | Sum of all fixed costs for that CDM across the profile. This is the default sort column when the table displays. |
| Avg Qty/Case w/ Chg |
Average Quantity per Case with Charge: (Profile Quantity) divided by (Profile Volume with Charge). This is the average number of times that CDM was charged to each encounter (for cases with that charge). |
| % of Cases Used* |
*only in Detailed View Type; Percent of Cases Used: (Profile Volume with Charge) divided by (Profile Volume). This is the percent of the profile encounters that had at least one charge for that CDM. |
| Avg Total Fixed Cost /Case w/ Chg |
Average Total Fixed Cost per Case with Charge: (Profile Total Fixed Cost) divided by (Profile Volume with Charge). This is the average amount of fixed costs incurred for that CDM by each encounter (for cases with that charge). |
Charges/Cost Column: Total Variable Cost
| Column | Description |
|---|---|
| Facility ID | ID number of the facility associated with the CDM. |
| CDM # (Charge Description Master Number) | A hospital-specific identification number for the charge description. |
| Description | Hospital-specific name for the CDM charge. |
| Rev (Revenue) Code | An industry-standard grouping for charges; see Revenue Code Categories for a list of revenue codes. |
| Profile Volume* | *only in Detailed View Type; volume of encounters in the profile for that facility. |
| Profile Volume w/ Chg | Profile Volume with Charge: Number of encounters in the profile with charges for that CDM. |
| Profile Qty | Profile Quantity: Quantity of that CDM charged across the profile. |
| Profile Total Variable Cost | Sum of all variable costs for that CDM across the profile. This is the default sort column when the table displays. |
| Avg Qty/Case w/ Chg |
Average Quantity per Case with Charge: (Profile Quantity) divided by (Profile Volume with Charge). This is the average number of times that CDM was charged to each encounter (for cases with that charge). |
| % of Cases Used* |
*only in Detailed View Type; Percent of Cases Used: (Profile Volume with Charge) divided by (Profile Volume). This is the percent of the profile encounters that had at least one charge for that CDM. |
| Avg Total Variable Cost /Case w/ Chg |
Average Total Variable Cost per Case with Charge: (Profile Total Variable Cost) divided by (Profile Volume with Charge). This is the average amount of variable costs incurred for that CDM by each encounter (for cases with that charge). |
Charges/Cost Column: Total Indirect Cost
| Column | Description |
|---|---|
| Facility ID | ID number of the facility associated with the CDM. |
| CDM # (Charge Description Master Number) | A hospital-specific identification number for the charge description. |
| Description | Hospital-specific name for the CDM charge. |
| Rev (Revenue) Code | An industry-standard grouping for charges; see Revenue Code Categories for a list of revenue codes. |
| Profile Volume* | *only in Detailed View Type; volume of encounters in the profile for that facility. |
| Profile Volume w/ Chg | Profile Volume with Charge: Number of encounters in the profile with charges for that CDM. |
| Profile Qty | Profile Quantity: Quantity of that CDM charged across the profile. |
| Profile Total Indirect Cost | Sum of all indirect costs for that CDM across the profile. This is the default sort column when the table displays. |
| Avg Qty/Case w/ Chg |
Average Quantity per Case with Charge: (Profile Quantity) divided by (Profile Volume with Charge). This is the average number of times that CDM was charged to each encounter (for cases with that charge). |
| % of Cases Used* |
*only in Detailed View Type; Percent of Cases Used: (Profile Volume with Charge) divided by (Profile Volume). This is the percent of the profile encounters that had at least one charge for that CDM. |
| Avg Total Indirect Cost /Case w/ Chg |
Average Total Indirect Cost per Case with Charge: (Profile Total Indirect Cost) divided by (Profile Volume with Charge). This is the average amount of indirect costs incurred for that CDM by each encounter (for cases with that charge). |
Charges/Cost Column: Total Direct Cost
| Column | Description |
|---|---|
| Facility ID | ID number of the facility associated with the CDM. |
| CDM # (Charge Description Master Number) | A hospital-specific identification number for the charge description. |
| Description | Hospital-specific name for the CDM charge. |
| Rev (Revenue) Code | An industry-standard grouping for charges; see Revenue Code Categories for a list of revenue codes. |
| Profile Volume* | *only in Detailed View Type; volume of encounters in the profile for that facility. |
| Profile Volume w/ Chg | Profile Volume with Charge: Number of encounters in the profile with charges for that CDM. |
| Profile Qty | Profile Quantity: Quantity of that CDM charged across the profile. |
| Profile Total Direct Cost | Sum of all direct costs for that CDM across the profile. This is the default sort column when the table displays. |
| Avg Qty/Case w/ Chg |
Average Quantity per Case with Charge: (Profile Quantity) divided by (Profile Volume with Charge). This is the average number of times that CDM was charged to each encounter (for cases with that charge). |
| % of Cases Used* |
*only in Detailed View Type; Percent of Cases Used: (Profile Volume with Charge) divided by (Profile Volume). This is the percent of the profile encounters that had at least one charge for that CDM. |
| Avg Total Direct Cost /Case w/ Chg |
Average Total Direct Cost per Case with Charge: (Profile Total Direct Cost) divided by (Profile Volume with Charge). This is the average amount of direct costs incurred for that CDM by each encounter (for cases with that charge). |
